Every January, the same scene plays out in marketing departments across Malaysia: someone opens a planning doc titled “CNY Campaign” — two weeks before Chinese New Year.
The data in this study suggests that the planning starts a full quarter too late. The hamper buyers started searching in October. The decoration buyers in September. By the time the campaign brief is approved, the only demand left to catch is last-minute cookies.
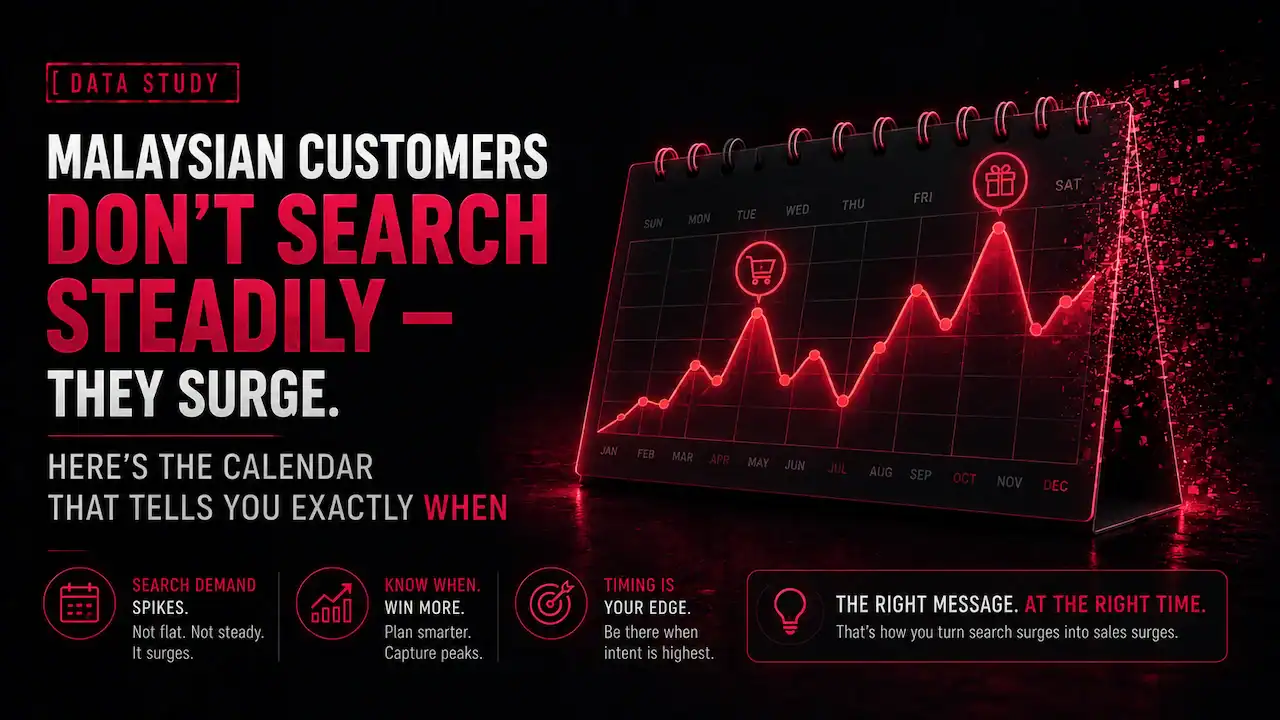
We pulled 24 months of monthly search volume — June 2024 through May 2026 — for 52 festival and seasonal keywords across nine Malaysian events: Raya, Ramadan, CNY, Deepavali, Christmas, Merdeka, 11.11, 12.12 and the school holidays. In three languages, researched natively: English, Bahasa Melayu and Chinese.
What came back is a complete demand calendar for Malaysian marketing — when every wave actually starts, how high it actually goes, and how the dates move under your feet from one year to the next.
It also came back with one finding nobody’s campaign calendar accounts for: the single biggest seasonal search event in Malaysia isn’t Raya. It isn’t CNY. It’s the flag.
Key Findings (TL;DR)
- “bendera malaysia” peaks at 375,511 searches in August — 16× its baseline, and bigger at peak than the peak month of our entire CNY basket (177k), Raya basket (91k) or Christmas basket (46k). Merdeka is Malaysia’s largest seasonal search event, and almost nobody plans for it.
- Demand ramps by dimension, not by festival: decorations and gifting terms start climbing 2–4 months before the festival (cny decoration: 4 months out; deepavali hamper: 3), while food terms arrive with the festival itself (1–2 months). Plan one campaign date for everything, and you miss the early wave.
- Off-season, festival queries don’t decline — they vanish: “12.12 sale” runs at a multiplier of ~1,089× its off-season baseline, “buffet ramadhan” 366×, “yee sang” 174×, “merdeka promotion” effectively from zero.
- The calendar moves: between the two cycles, the CNY search peak shifted from January to February and the Ramadan buffet peak from March to February — the ~11-day annual drift of the lunar and Islamic calendars, visible in raw volume.
- Chinese-script searches carried 31% of measured CNY peak demand in 2025 — 年饼 out-peaks “cny cookies” roughly 2:1. An English-and-BM-only calendar misses a fifth to a third of CNY.
- The counter-finding: school-holiday travel demand barely moves (1.2× aggregate), “tiket bas” is flat year-round, and “saree” shows almost no Deepavali spike — it’s a wardrobe staple. A seasonal budget on non-seasonal terms is pure waste.
- 11.11 branded search diverged: “lazada 11.11” grew +46% year-over-year while “shopee 11.11” fell −47%; Chinese-language “双十一” grew +63%.
Methodology
We selected 52 keywords across nine recurring Malaysian demand events, each tagged by event, dimension (shopping/gifting, food, travel, deals) and language. BM and Chinese keywords were researched natively from Malaysian usage, never translated; Chinese terms use simplified script. All keywords were volume-validated (≥50/month current volume) before the pull; four low-volume candidates returned no usable history and were excluded.
For each keyword, we pulled 24 months of monthly search volume (June 2024 – May 2026) from Ahrefs’ volume history for Malaysia, captured on 11 June 2026. That window contains two full cycles of every event: two CNYs (29 Jan 2025, 17 Feb 2026), two Ramadans (starting 1 Mar 2025, 18 Feb 2026), two Rayas (31 Mar 2025, 20 Mar 2026), two Deepavalis (31 Oct 2024, 20 Oct 2025), two Merdekas, two 11.11s, two Christmases.
For every keyword, we computed three things: the off-season baseline (median of its 12 lowest months), the peak multiplier (peak month ÷ baseline), and the ramp — how many months before the peak the volume first crosses twice its baseline. The full dataset and analysis script ship with this article.
Finding 1: Malaysia’s Biggest Seasonal Search Event Is Not A Festival

Line up the peak months of our nine event baskets, and the league table reads like this:
Event basket | Peak month volume | Multiplier vs baseline |
Merdeka | 386,503 (Aug 2024) | 16.5× |
CNY | 176,987 (Jan 2025) | 13.3× |
Raya | 91,488 (Mar 2025) | 4.2× |
School holidays | 54,685 | 1.2× |
Christmas | 46,086 (Dec 2024) | 22.6× |
Deepavali | 22,436 (Oct 2024) | 4.0× |
Ramadan | 21,865 (Mar 2025) | 6.2× |
11.11 | 5,921 (Nov 2024) | 14.0× |
12.12 | 3,266 (Dec 2025) | 1,088.7× |
One keyword does most of Merdeka’s work: “bendera malaysia” — 375,511 searches in August 2024, 331,229 in August 2025, against a baseline around 23,000. Every August, searching for the flag becomes one of the largest single demand events in Malaysian search — bigger at peak than every yee sang, baju raya, and christmas tree query in this study put together.
And the commercial intent beside it is real: “merdeka promotion” goes from effectively zero to 6,211; “merdeka sale” to 4,781. Both spin up in July and are dead by mid-September.
The table holds a second quiet surprise: Christmas. “christmas tree” alone peaks at 29,775 — a 15.5× December surge — and “christmas gift ideas” multiplies 269× from a near-zero baseline. Malaysia rarely frames itself as a Christmas retail market, yet the measured December basket (46k) is a serious commercial event hiding behind the assumption that it’s “not our festival.” (Basket sizes reflect our keyword selection — see Limitations — but a 29,000-search December keyword is not an artefact.)
Malaysian marketers plan around four festivals and ignore the one month the entire country searches in unison.
The flag query itself is informational — schools, offices, Jalur Gemilang printouts. But it marks a window of national attention with proven sale-intent terms attached, a near-empty content lane (who owns “merdeka promotion” content? almost nobody), and a hard annual deadline. For brands with any patriotic-season angle, this is the cheapest big wave on the calendar.
Finding 2: Demand Doesn’t Ramp By Festival. It Ramps By Dimension.

The most useful pattern in 24 months of data isn’t when festivals peak — everyone knows roughly when CNY is. It’s that the buyer’s mission decides when they start searching, and the missions are staggered:
Decorations & gifting move first — 2 to 4 months out. “cny decoration” starts its climb four months before its January peak; “cny cookies” likewise begins in September–October; “deepavali hamper” crosses 2× baseline three months before Deepavali; “christmas gift ideas” ramps from September; “cny hamper” three months out. These buyers are organising, ordering, comparing — early.
Food-related searches arrive with the festival — 1 to 2 months. “yee sang” explodes only in the CNY month itself (with a December warm-up); “bak kwa” and 肉干 peak in the festival month; “buffet ramadhan” goes vertical only when Ramadan bookings open; “kuih raya” peaks in the Raya month.
And some demand peaks after the festival starts. “sampul duit raya” peaks in April — after Raya begins in late March — because duit raya season runs through Syawal’s open houses. “balik kampung” peaks in April too. Raya is not one wave; it’s a shopping wave (Feb–Mar), then a travel-and-social wave (Apr).
The Raya basket also hides a keyword lesson. The biggest apparel term isn’t the festival-stamped one: “baju melayu” peaks at 28,825 — half again the size of “baju raya” at 19,201 — because Malaysians shopping for Raya clothes search for the garment, not the occasion. The same logic killed “jualan raya” (10 searches) in our validation while “hamper raya” runs a 553× festival switch. The demand is enormous; the words it uses are not the words in most campaign briefs. Native keyword research isn’t a nicety for festival campaigns — it’s the difference between targeting the wave and targeting its label.

Here’s the whole study compressed into the table your media plan actually needs — when to be live, by event, based on when search demand crosses twice its baseline:
Event | Demand starts | Peak | Be live by |
CNY (decor/gifting) | ~4 months out (Sep–Oct) | CNY month | September |
CNY (food) | Dec | CNY month | November |
Raya shopping | ~2 months pre-Ramadan | Raya month | December–January |
Raya travel/duit raya | Ramadan | Syawal (month after Raya) | Ramadan start |
Ramadan F&B | 2–3 months out | Ramadan months | November–December |
Deepavali (gifting/decor) | Aug–Sep | October | August |
Merdeka | July | August | June |
11.11 / 12.12 | October / November | Nov / Dec | September |
Christmas | Sep–Oct | December | September |
If your CNY campaign starts in January, you didn’t run a CNY campaign. You ran a clearance sale for the customers everyone else had already served.
Finding 3: Off-Season, These Queries Don’t Decline. They Cease To Exist.
The multipliers in this study are not “seasonality” as most dashboards imagine it — a gentle sine wave. They’re a switch:
- “12.12 sale”: ~1,089× its baseline (3,266 peak vs a baseline of roughly three searches)
- “buffet ramadhan”: 366× (6,781 vs 18)
- “yee sang”: 174× (66,732 vs 383)
- “merdeka promotion”: from ~zero to 6,211
- – “hamper raya”: 553× · “christmas gift ideas”: 269× · “deepavali hamper”: 168×
Two practical consequences hide in those numbers.
First, annual averages lie about festival keywords. “buffet ramadhan” reports ~450 searches a month as its headline volume. The real shape is two months of 2,000–6,800 and ten months of nothing. Any keyword decision made on the annual number — “too small to bother” — is being made on a fiction.
Second, rankings must be in place before the switch flips, because there’s no traffic to learn from off-season. A page published in February for a March Ramadan term has no runway. The SEO lead time for festival terms isn’t “before the festival” — it’s before the ramp, which Finding 2 just dated for you.
Your dashboard shows festival keywords as small all year. They’re not small. They’re asleep — and they wake up rich.
Finding 4: The Calendar Is Moving Under Your Campaign Plan
Between our two measured cycles, the peaks themselves moved:
- CNY peak: January 2025 → February 2026. “yee sang” (Jan 62,784 → Feb 66,732), 捞生, and “reunion dinner” all shifted with the date: CNY fell on 29 Jan 2025, then 17 Feb 2026.
- Ramadan buffet peak: March 2025 → February 2026 — Ramadan started 1 Mar 2025, then 18 Feb 2026.
- Raya stayed in March both years (31 Mar → 20 Mar) — but it won’t next time.
This is the lunar and Islamic calendar drift — roughly 11 days earlier each year for Islamic dates — showing up in raw search volume. And it compounds: Ramadan 2027 begins around 8 February, putting Raya around 10 March — which means Raya shopping demand in the 2027 cycle starts climbing in December 2026, colliding head-on with Christmas and 12.12 inventory and ad auctions. CNY 2027 (6 February) lands inside Ramadan’s first week — a triple-overlap quarter.
Copy-pasting last year’s campaign dates is the quiet failure mode of Malaysian seasonal marketing. The festivals move; the Gantt charts don’t.
Whoever owns a drifting calendar owns a recurring advantage: this study’s dates expire, by design, every single year — and so does your competitor’s plan.
Finding 5: The Demand That Never Spikes (Stop Paying Seasonal Prices For It)

Honesty section: a third of this basket refused to behave seasonally, and that’s a finding.
- School holidays as a “season” barely exists in search: the seven-keyword travel basket moves just 1.2× between its quietest and busiest months. “cuti sekolah” is searched heavily all year — it’s a planning query, not a holiday query.
- “tiket bas”: 1.3×. Malaysians buy bus tickets year-round; even Raya barely dents the curve. The balik-kampung crush is real on the roads — it just doesn’t translate into a proportional search spike for the generic term.
- “saree”: 1.3×. Almost no Deepavali lift — it’s wardrobe shopping, not festival shopping. Compare “deepavali hamper” at 168×.
- “cheongsam”: only 4.7× — a real CNY lift, but the term lives year-round as fashion.
- “shopee sale”: completely flat. Generic deal-hunting is ambient, not seasonal.
The cost of getting this wrong runs in both directions. Brands run “Deepavali saree campaigns” into a term that doesn’t spike, and ignore “cuti sekolah” content because “it’s seasonal” when it’s actually a 20,000-a-month evergreen. Half of the seasonal marketing budget isn’t mistimed — it’s pointed at demand that was never seasonal to begin with.
Finding 6: CNY Happens In Three Scripts — And You’re Probably Measuring One

We tracked the CNY basket in English and Chinese (simplified script — the form that Malaysian Chinese overwhelmingly use). At the 2025 peak month, the split of measured demand:
- English CNY terms: 122,040 searches
- Chinese CNY terms: 54,947 — 31% of the total (22% at the 2026 peak)
And it’s not a uniform discount — it’s category warfare. 年饼 peaks at 5,195 against “cny cookies” at 2,878: the Mandarin term roughly doubles the English one. 捞生 adds 15,549 on top of “yee sang”‘s monster numbers. 红包 peaks at 14,443 — there is no comparable English equivalent in the basket (“ang pow packet” was too small to return usable history at all).
This extends what our Mandarin SERP study found about ranking competition into the demand side: a CNY campaign planned from English keyword tools alone is reading two-thirds to three-quarters of the actual market and calling it the whole.
Every CNY, brands fight over the English keywords while a third of the season’s demand searches in a script their keyword tool was never asked about.
(BM completes the trilingual picture on the Raya side, where the entire basket is BM-native: baju melayu 28,825 at peak, kuih raya 23,366, baju raya 19,201. Part 1 — BM vs English study explains how to research BM keywords natively, while Part 2 covers Mandarin; this study shows what the calendar looks like when you do.)
Finding 7: The 11.11 Split Nobody Noticed
Year-over-year, at peak:
- “lazada 11.11”: 2,265 → 3,303 (+46%)
- “shopee 11.11”: 2,642 → 1,399 (−47%)
- “12.12 sale”: 2,213 → 3,266 (+48%)
- 双十一 (Chinese-language 11.11): 538 → 876 (+63%)
A careful read: these are branded search volumes, not GMV — they measure who’s pulling curiosity toward Google, not who’s winning checkout. But a 93-point swing between the two platforms’ branded event searches in a single year is a signal about campaign mindshare, and the growth of 12.12 and the Chinese-language term says the mega-sale season is broadening, not fading — it’s becoming a Nov–Dec corridor rather than a single day.
For everyone who isn’t Shopee or Lazada, the practical note is Finding 2’s: the corridor’s search ramp begins in October, and “voucher”/deal-hunting demand around it is year-round ambient noise, not a spike you can ambush.
The Year, Walked Through
Stitch the 52 curves together, and the Malaysian search year has a shape worth internalising as a whole:
Q1 (Jan–Mar) is the compression chamber. CNY demand peaks (in January or February — check the date), and before its tail fades, Ramadan F&B ignites, and Raya shopping is already climbing. “kurma” runs its 4.3× climb to 15,084 through Ramadan; “kuih raya” goes vertical into March. For food, retail and fashion, Q1 is two overlapping festival economies sharing one quarter — and in drift years like 2027, three.
Q2 (Apr–Jun) is the tail nobody monetises. April carries the Syawal after-wave — duit raya, balik kampung, open houses — then demand genuinely rests. May–June is the cheapest quarter in Malaysian search: the right window for building the content that must rank by September.
Q3 (Jul–Sep) belongs to the flag. Merdeka’s July ramp and colossal August peak stand almost alone — the least contested major wave of the year. September quietly doubles as the start line: CNY decoration, Deepavali gifting and Christmas gifting all cross 2× baseline before September ends.
Q4 (Oct–Dec) is not a sequence of events. It’s one continuous corridor. Deepavali peaks in October, 11.11 in November, 12.12 and Christmas in December, while CNY’s ramp is already underway underneath all of it. From the first week of October to Chinese New Year, measured demand in this study never returns to baseline. Brands that plan Q4 as four separate campaigns burn four sets of setup costs on what the data shows is a single 100-day season.
Malaysia doesn’t have a festive season. From October to Raya, it has a festive half-year — and most budgets are built for the two weeks around each holiday.
What This Means: Timing Is A Channel Decision
The calendar above isn’t channel-neutral — each demand phase belongs to a different tool.
SEO owns the ramp — if it starts early enough. Festival pages need to rank before demand crosses 2× baseline, because by the peak it’s too late to climb. Working back from Finding 2: CNY content live and indexed by September, Raya content by December, Merdeka by June. Festival content is also the rare SEO asset that compounds annually — the same kuih raya page collects every March for years (URL evergreen, no year-stamped slugs). Building these pages as part of a long-term SEO programme ensures they continue delivering value every festival season.
Ads own the peak. When a query does 366× in eight weeks, the efficient move is to concentrate budget on the curve, not a year-round trickle — and the drift in Finding 4 means those flight dates must be rebuilt each year from the festival date, not copied from last year’s plan. The auction collision warning for the 2027 cycle: December 2026 will carry Christmas + 12.12 + early-Raya demand simultaneously; CPCs in that window will not behave. Effective campaign flighting and Google Ads management ensure budgets are concentrated during these short demand windows instead of being spread evenly throughout the year.
Social owns the after-wave. April’s duit-raya and open-house demand peaks after the campaign budgets close. The brands still posting in Syawal are alone in the feed with an audience that’s still searching. Maintaining an always-on social presence helps brands stay visible during these post-festival demand periods when competitors have already gone quiet.
One calendar, three channels, staggered hand-offs. The marketing plan this data supports isn’t “do festival campaigns” — everyone does festival campaigns. It’s: be findable during the ramp, buy the peak, stay social through the tail, and re-derive the dates every single year.
There’s a budget-shape implication underneath all of this. Most Malaysian marketing budgets are flat twelve-month lines with festival “toppers” — but the demand they’re chasing is a Q4-to-Q1 corridor carrying the majority of the year’s seasonal volume, a near-silent Q2, and a single-keyword mountain in Q3. A budget shaped like the demand would spend its content money in the quiet Q2 (building what must rank by September), hold its heaviest paid budget for the October-to-CNY corridor, and treat the post-Raya months as the year’s R&D window rather than forcing campaigns into them. The companies that match the spend curve to the demand curve get compounding returns from the same ringgit; the flat-line budgets subsidise them.
Run This Yourself
The dataset (52 keywords × 24 months, tagged by event, dimension and language) and the analysis script are available on request — reach out and we’ll send the pack. The script prints every baseline, multiplier, ramp and drift in this study.
To build a calendar for your own category: take 10–15 of your seasonal terms (research BM and Chinese terms natively — translation will betray you), pull 24 months of monthly volume so you capture two cycles, and compute the same three numbers per keyword — baseline, multiplier, ramp. Your campaign start date is the ramp date, not the festival date.
Limitations (Read These Before Quoting)
- Estimates, not ground truth. Monthly volumes are Ahrefs modelled estimates; treat shapes and ratios as more reliable than absolute counts.
- Two cycles only. The 24-month window captures each event twice — enough to see the drift, not enough to call multi-year trends (the 11.11 platform divergence in particular is one year-pair).
- Basket scope. 52 keywords across nine events is a planning skeleton, not a census of any single festival’s demand. Per-festival totals compare our baskets, not the festivals’ full search universes — Merdeka’s lead is driven by one colossal keyword.
- Peak attribution. Monthly granularity blurs events that straddle month boundaries (CNY mid-February splits demand across two months; Raya on 31 March pushes some demand into April).
- Tamil is unmeasured. The trilingual coverage here is EN/BM/CN; Deepavali demand in Tamil script is real and absent from this study — it’s the planned Part 3 of our language series.
- Branded caution. “shopee 11.11” / “lazada 11.11” trends measure branded search interest, not sales or market share.
FAQ
When exactly should I launch my CNY campaign?
Decor and gifting: be live by September–October. Food and F&B: November–December. And check the actual CNY date first — it moved three weeks between our two measured cycles.
Is the Merdeka spike actually monetizable, or is it all students searching for flag images?
The flag query itself is largely informational — but “merdeka sale” and “merdeka promotion” jumping from near-zero to 4,000–6,000 in August is commercial demand, and the content lane around the season is nearly empty. It’s the least contested big wave in this study.
Why do my keyword tools say festival terms are tiny?
Annual averaging. A term doing 6,800 for one month and ~20 for eleven reports as ~450/month. Pull the monthly history before judging any seasonal keyword — the average is a fiction for switch-shaped demand.
Does this calendar work for paid ads too?
It’s arguably more useful for paid than organic: the ramp dates are your flight start dates, and the drift means you must rebuild flights annually from the festival date. See the channel breakdown above. The same SEO-and-paid relationship was also demonstrated in our marketplace SERP study, where organic visibility and paid campaigns worked together to maximise demand capture.
What about Tamil keywords for Deepavali?
Unmeasured here, real in the market — Part 3 of our language series will cover it. Treat our Deepavali numbers as the EN-visible floor, not the ceiling.
Want this calendar built for your category — your keywords, your verticals, with the ramp dates your campaigns should actually launch on? We’ll run the same 24-month analysis on your seasonal terms and hand you a dated campaign calendar for the next 12 months. Drop us a line for a festival demand review.